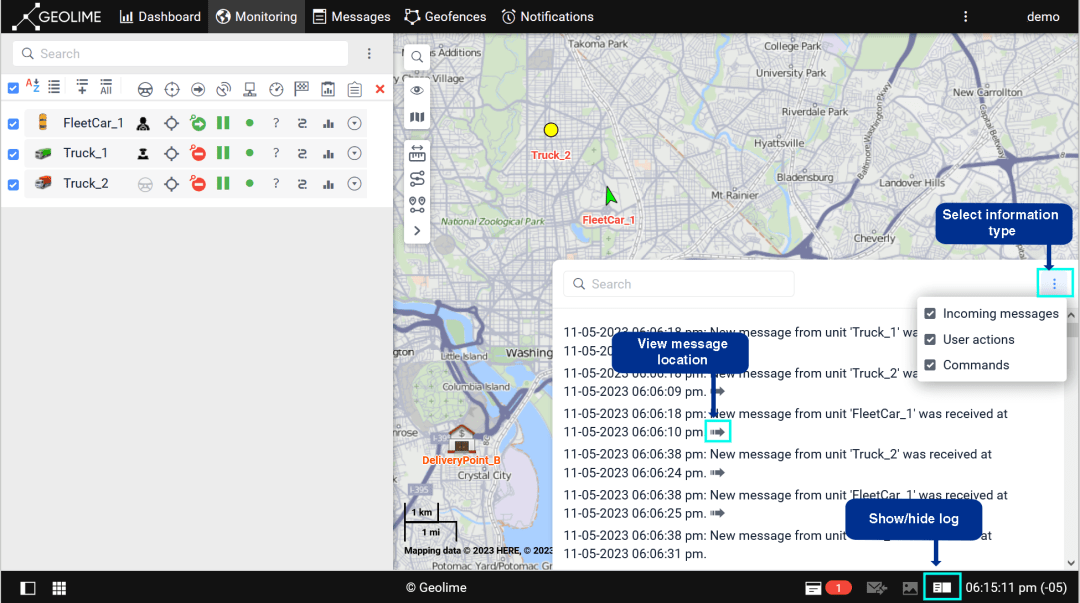
The log shows real-time information about data sent and received from IoTplot terminals. This could be useful in cases when troubleshooting is required.
To open the log, click on the icon in the bottom panel.
To select the types of information which should be shown in the log, click on the icon and select the required items.
| Item | Description |
| Incoming messages |
Records of the messages received from the units (only units added to the work list of the Monitoring tab). If a message contains data on the unit location, the icon is shown at the end of the record. Click on it to see the place of sending the message on the map.
If messages are synchronization messages (sent from the IoTplot terminal’s memory moments after a weak or lost signal), the log shows only those that have been generated no earlier than one hour before the last message with coordinates. |
| User actions | Records of your actions in the monitoring system: creating, editing, deleting elements, etc. |
Different colors are used to display text in the log:
- black: for records of the received unit messages;
- green: for records of the user actions, sent and executed commands;
- red: for records of errors.
To quickly find the required record, use the dynamic search.
You can change the log size by dragging its border or corner.


